By: Prof. Enrique Michael Flores
PICKING THE RIGHT STOCK
There are two main paradigms in analyzing stocks…they are fundamental analysis and technical analysis. If you have been investing already, I am sure that you have already heard of these two. If you haven’t, please look them up since I will be discussing key metrics that assume familiarity with the terms. For this article, we will focus on technical analysis.
Technical Analysis:
Technical analysis (TA) is both the science and the art of analyzing the chart of any given stock. The TA analyst or technician believes that any relevant information that can be derived from a Company’s earnings, business strategy, or competitive advantage is all reflected in its stock price.
Don’t get me wrong. Fundamental analysis is still essential in making your investment decision, but to simplify the two types of analysis, here’s how I would describe it:
Fundamental analysis helps you to select which stock or company to buy.
Technical analysis helps you to identify the entry and exit points, as well as whether the stock is in an uptrend, downtrend, or ranging.
The most important concepts you will need to learn when delving into the technical analysis are the concepts and identifying of support and resistance, and trend lines.
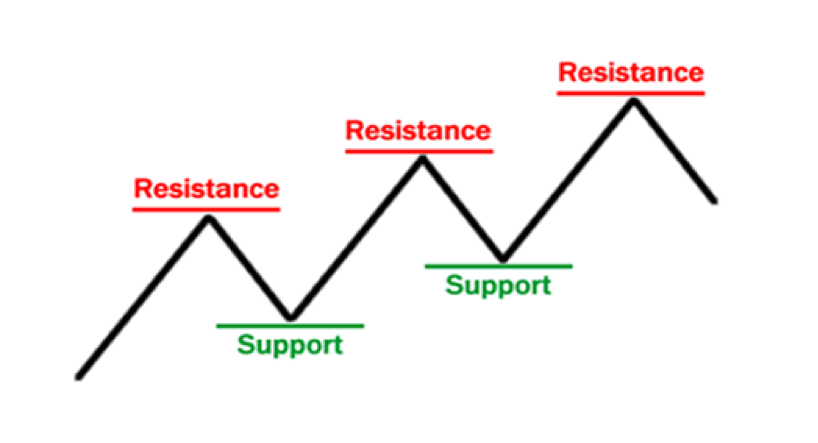
Support is the area that traders feel that the price or level is the right entry-level. Buyers or bulls think that the price is at a reasonable level and step in to purchase more shares than sellers/ bears are selling. Remember that support is not a single line or a single price, but an area.
Resistance is the area that traders or investors feel that the price or level is a good level to sell their shares. Sellers or bears think that they have reached a certain amount of profit and wish to sell or lock in those profits. As support, resistance is not a single line or a single price, but an area.
Below is a photo of support and resistance in theory.
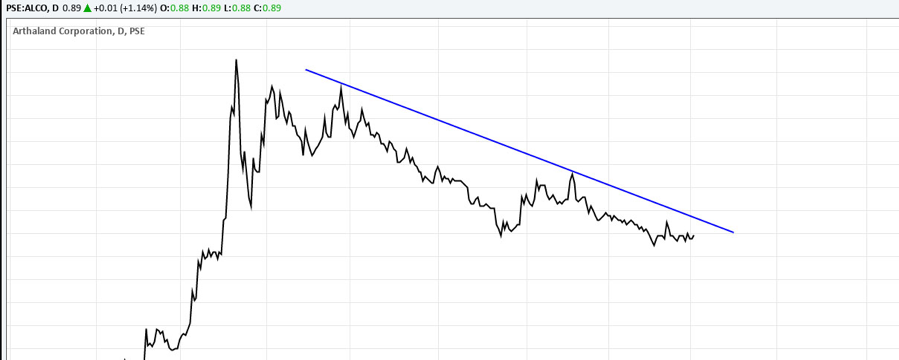
Trendlines: with the assumption that prices move in trends, the trendline is a line drawn under the pivot lows of stocks moving in an uptrend or pivot highs of stocks moving in a downtrend. Remember that at least 2 points must touch the line for it to be valid.
Here’s an example of a downtrend line in ALCO.
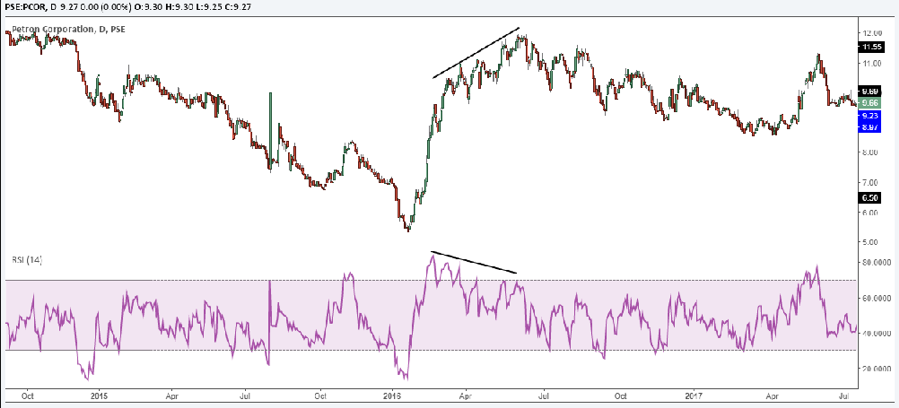
Divergence is a concept where an oscillator or indicator does not reflect price flow. For example, a bearish divergence occurs when prices make higher highs, but the indicator such as RSI is making lower highs or is flat. The indicator is a precedence for a bearish reversal of the trend. Below is an example of a bearish divergence occurring in PCOR with the Relative Strength Indicator (RSI).
Bullish divergences should be sought in a downtrend as this occurrence signifies trend reversal and could be a good entry point. Below is an example of bullish divergence:
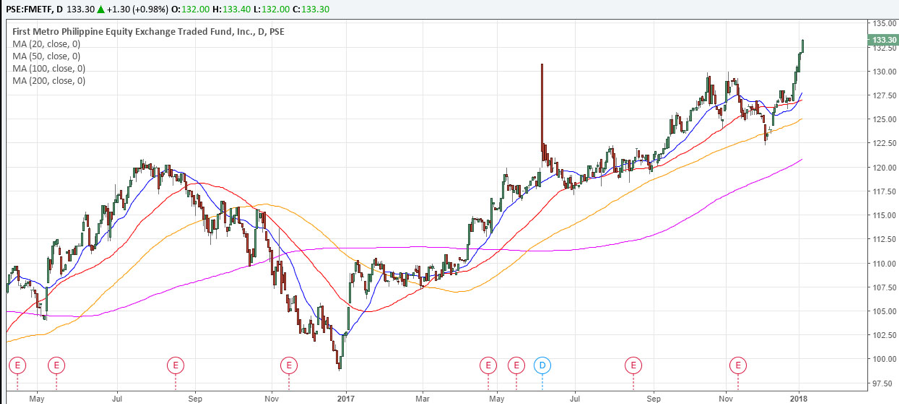
Moving Averages is a line that is visible on the chart taking the average (usually of the close) for the past number of days that the user has set. The most commonly used ones are the MA 20, MA 50, MA 100, and MA 200. The combination of MA 20, MA 50, and MA 100 was made famous by the trader Zeefreaks by using them in conjunction when these three MAs formed “Zeus Strike” and “Alignment of the Stars.” The MA 200 is used to determine whether a stock is in bullish or bearish territory. If stocks are trading above the MA 200, then these are bullish, and below, it would mean bearish.
In the picture below of FMETF, the moving averages are as follows: MA 20 – blue, MA 50 – red, MA 100 – orange, MA 200 – pink.